A little while ago I wrote up some of the key details on making a WordPress based website on Google cloud. In this post, a few additional things are discussed which make a WordPress setup a little nicer in terms of data and visualization.
Google Analytics…
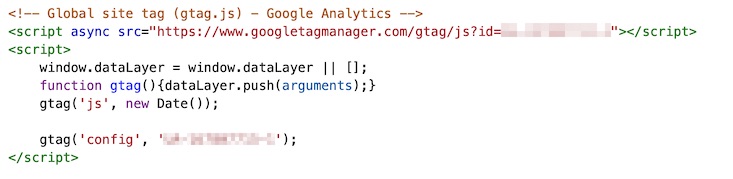
Google Analytics can be included either with a plugin or manually. Since it only involves two steps, the manual method is pretty easy to do. First, on the google analytics website the an account and tracking id needs to be created for a particular site.
Next in the theme’s header.php file, just before the </head> tag, the following code needs to be added with the correct tracking id value.
View Count…
WordPress does not count the number of times that a post was viewed. It can easily be done by adding a small amount of code (to functions.php and single.php) which keeps track of the view count in the database. Then a script can query the database, grab the counts, and make some type of visualization.
WordPress Code Changes…
First, it is recommended not to directly change a theme’s files; instead one should make a child theme and modify those files. The main changes involve writing the view count number in the database to the wp_postmeta table. There, the table consists of the following structure:
| Columns: | meta_id | post_id | meta_key | meta_value |
| Types: | bigint | bigint | varchar(255) | longtext |
The view count will be stored for each post (that is post_id), using a specific meta_key (post_views_count) and the meta_value fields.
At the end of the theme’s (or child theme’s) functions.php file the following code needs to be added which will add and update the post_views_count for the particular post (note that this code is made from combination of various sources from the web with some extra fixes from myself; I am not going to cite the various stack overflow posts, but this one page helped a lot).
// get_post_views: Used whenever the view count is needed internally by wordpress
function get_post_views ($postID)
{
    $count_key = 'post_views_count';
    $count = get_post_meta($postID, $count_key, true);

    // If the key is NULL then...
    if ($count=='')
    {
        // Add it in and set it to zero.
        delete_post_meta ($postID, $count_key);
        add_post_meta ($postID, $count_key, '0');

        return "0 Views";
    }

    // For one view... note view is singular
    if ($count=='1')
    {
        return "1 View";
    }

    // Otherwise result the count and view is plural
    return $count.' Views';
}

// set_post_views: Used to update the view count for a post
function set_post_views ($postID)
{
    // Only count views on published posts; that is not in preview mode
    if (get_post_status ($postID) !== 'publish')
    {
        return;
    }

    $count_key = 'post_views_count';
    $count = get_post_meta ($postID, $count_key, true);

    // if the key is NULL then this is the first time it is being used...
    if ($count=='')
    {
        // This is the first view
        $count = 1;
        delete_post_meta ($postID, $count_key);
        add_post_meta ($postID, $count_key, '1');
    }
    else
    {
        // Otherwise increment the view count...
        $count++;
        update_post_meta($postID, $count_key, $count);
    }
}

// Remove issues with prefetching adding extra views
remove_action( 'wp_head', 'adjacent_posts_rel_link_wp_head', 10, 0);

// posts_column_views: Add to a column in WP-Admin
function posts_column_views($defaults)
{
    $defaults['post_views'] = __('Views');
    return $defaults;
}

// posts_custom_column_views: Add content to the views column
function posts_custom_column_views($column_name, $id)
{
    if ($column_name === 'post_views')
    {
        echo get_post_views (get_the_ID());
    }
}

add_filter ('manage_posts_columns', 'posts_column_views');
add_action ('manage_posts_custom_column', 'posts_custom_column_views',5,2);
Now in theme’s single.php file, at the end of the central while loop, the following needs to be added which updates the page count.
while (have_posts()):
    .
    .
    .
    set_post_views (get_the_ID());
endwhile;
After these changes have been made, only pages that have been viewed will have an associated post_views_count entry. Posts that have not yet been viewed will have no entry.
Querying the WP Database…
Outside of the the WordPress environment (say in a Python script), the WP database can be interacted with and data can be extracted, updated, or even deleted. To get any useful information a few tables need to be joined together which contain the post details (wp_posts) and category/tag details (wp_term_taxonomy and wp_term_relationships). Below is an SQL query which gets the top ten overall view counts.
SELECT pm.post_id as 'PostID', po.post_title as 'PostTitle', po.guid as 'URL', pm.meta_value as 'ViewCount'
    FROM wp_postmeta AS pm
    INNER JOIN wp_posts AS po ON pm.post_id = po.ID
    WHERE pm.meta_key = 'post_views_count'
    ORDER BY meta_value DESC, post_id ASC
    LIMIT 10
To get the top ten view counts for a particular category (as <CategoryName>), a few extra lines need to be added to the query:
SELECT pm.post_id as 'PostID', po.post_title as 'PostTitle', po.guid as 'URL', pm.meta_value as 'ViewCount'
    FROM wp_postmeta AS pm
    INNER JOIN wp_posts AS po
        ON pm.post_id = po.ID
    INNER JOIN wp_term_relationships as termRels
       ON termRels.object_id = po.id
    INNER JOIN wp_term_taxonomy as termTax
       ON termRels.term_taxonomy_id = termTax.term_id
    INNER JOIN wp_terms as terms
       ON terms.term_id = termTax.term_id
    # Note that terms.name is the name of the category
    WHERE pm.meta_key = 'post_views_count' AND terms.name = <CategoryName>
    ORDER BY meta_value DESC, post_id ASC
    LIMIT 10
Both of these queries can be executed in a tool such as MySQLWorkBench or even executed in a python script. The main things needed in a Python script are making a mysql.connector and cursor, executing the query, and processing the results:
import mysql.connector

cnx = mysql.connector.connect (user=<USERNAME> password=<PASSWORD>, database=<WPDATABASE>)

cursor = cnx.cursor ()
cursor.execute (<QUERY>);

# do something with the query results, like write them to a file

cursor.close()
cnx.close ()
The script can be executed once a day/week/month to see how view behaviours change.
Visualizing the View Counts…
Using a python script similar to the one above, the top 10 page views for posts in different categories were extracted from the database. The script outputs the post title, URL, and view counts to a file; then using the D3.js library the file was used to make an interactive graph. Note that this graph is also available on the about page.
Interactive Site Map…
Next, the WordPress database can be queried to extract both the categories and the tags for each post. For the visualization, we wish to compare the relative amount and size of all of the posts; also we would like to keep things ‘fun‘ and interactive. Therefore, a bubble graph is being used since it can handle all of these requirements.
In the bubble chart…
- Each page/post is a separate bubble and its length corresponds to the size of the bubble
- The bubbles shading is used to classify what category the post belongs to.
- Moving the mouse over each bubble displays the title of the post
- Double clicking a bubble allows the user to visit a particular post.
- Posts can be filtered in categories or in groupings based on tags. Filtering will colour the necessary bubbles and move them into their own section.
Interacting with the Database…
Since this is based on the posts stored in the database, and since they are added in semi-frequently by me, the script that queries the data is run manually. The script has two outputs: 1) a listing of all the posts (including their titles, IDs, URLs, lengths, categories, tags; and 2) listings of categories/tags and their associated IDs. Note that the association part is computed beforehand to make the visualization a little easier to code.
The main SQL query that is used to get all the categories and tags for all of the posts is:
SELECT DISTINCT
    ID,
    post_title AS 'PostTitle',
    LENGTH(post_content) AS 'PostSize',
    guid as 'URL',
    ( SELECT group_concat(wp_terms.name separator ', ')
          FROM wp_terms
          INNER JOIN wp_term_taxonomy on wp_terms.term_id = wp_term_taxonomy.term_id
          INNER JOIN wp_term_relationships wpr on wpr.term_taxonomy_id = wp_term_taxonomy.term_taxonomy_id
          WHERE taxonomy = 'category' and wp_posts.ID = wpr.object_id ) AS 'Categories',
    ( SELECT group_concat(wp_terms.name separator ', ')
          FROM wp_terms
          INNER JOIN wp_term_taxonomy on wp_terms.term_id = wp_term_taxonomy.term_id
          INNER JOIN wp_term_relationships wpr on wpr.term_taxonomy_id = wp_term_taxonomy.term_taxonomy_id
          WHERE taxonomy = 'post_tag' and wp_posts.ID = wpr.object_id ) AS 'Tags'
    FROM wp_posts
    WHERE post_type = 'post' AND post_status = 'publish'
    ORDER BY ID
D3 Bubble Maps…
D3.js provides the ability to create force directed graphs, which can be used to create bubble graphs. The main elements required are:
- Specifying the nodes… where for each node (or bubble) an object is created which contains the x and y position along with other information such as colours, radius, title, and URL
- Node visualization… a circle (or whatever type of shape) is drawn for each node.
- Simulation update… for each simulation step, a callback function is used to update the object positions.
- Specifying the force graph… the following code make a force graph and specifies 4 forces. The ‘charge’ force controls how much attraction (or repulsion) a node has, the x & y forces direct the nodes to their final positions, and the ‘collision’ describes when an object collides with other objects.
const simulation = d3.forceSimulation ()
                     .force ('charge', d3.forceManyBody().strength (charge))
                     .force ('x', d3.forceX().strength(forceStrength).x (centerPos.x))
                     .force ('y', d3.forceY().strength(forceStrength).y (centerPos.y))
                     .force ('collision', d3.forceCollide().radius ( function (d) { return d.radius + 1; }));
Below is my bubble graph made from all the published posts from this site. When a filter is applied, the graph will divide into two with the filtered posts on the left (and coloured green) and the remaining posts are grey and on the right. And again, each page can be visited using by double clicking on a particular bubble. This graph is also seen on the about page. Also note that the tag groups will change once more posts are added.
There are a few decent sources out there that describe making bubble graphs with D3, but perhaps this one is the best.
Code…
All of the code for the view count and bubble chart is available here.
No Comments