
Using Convolutional Neural Networks with the MNIST Image Set…
Previously the MNIST dataset was used in the examination of different classification techniques. This includes a variety of machine learning algorithms (including random forests, logistic regression, and xgboost), and simple neural networks. This time around, a few convolutional neural networks will be used to conclude the experiments with MNIST classifiers. Convolutional neural networks (or CNNs) …

MNIST Image Set with a Simple Neural Network…
Recently the MNIST image set was examined with some popular machine learning algorithms (including logistic regression, random forests, and xgBoost). This time a simple neural network is used to perform the classification. There is quite a bit of information about neural networks out there already, so the background information is being largely omitted. The key …

MNIST Image Set with Simple Machine Learning models…
This project is more of a ‘Hello World’ type of project in the world of machine learning and image processing. The MNIST dataset is a set of 70,000 images (that is 60,000 for training and 10,000 for testing) of handwritten digits of from 0 to 9. The MNIST images is perhaps one of the better …
Motion tracking using Accelerometers, Arduinos, and OpenGL
A while ago I was curious with the idea of motion tracking using and Arduino and some inexpensive sensors. It was one of my first more complete Arduino project where a variety of code had to written to handle serial communication, 3D graphics, and an OSX (i.e. Mac Desktop) application. Quick Background on Tracking There …
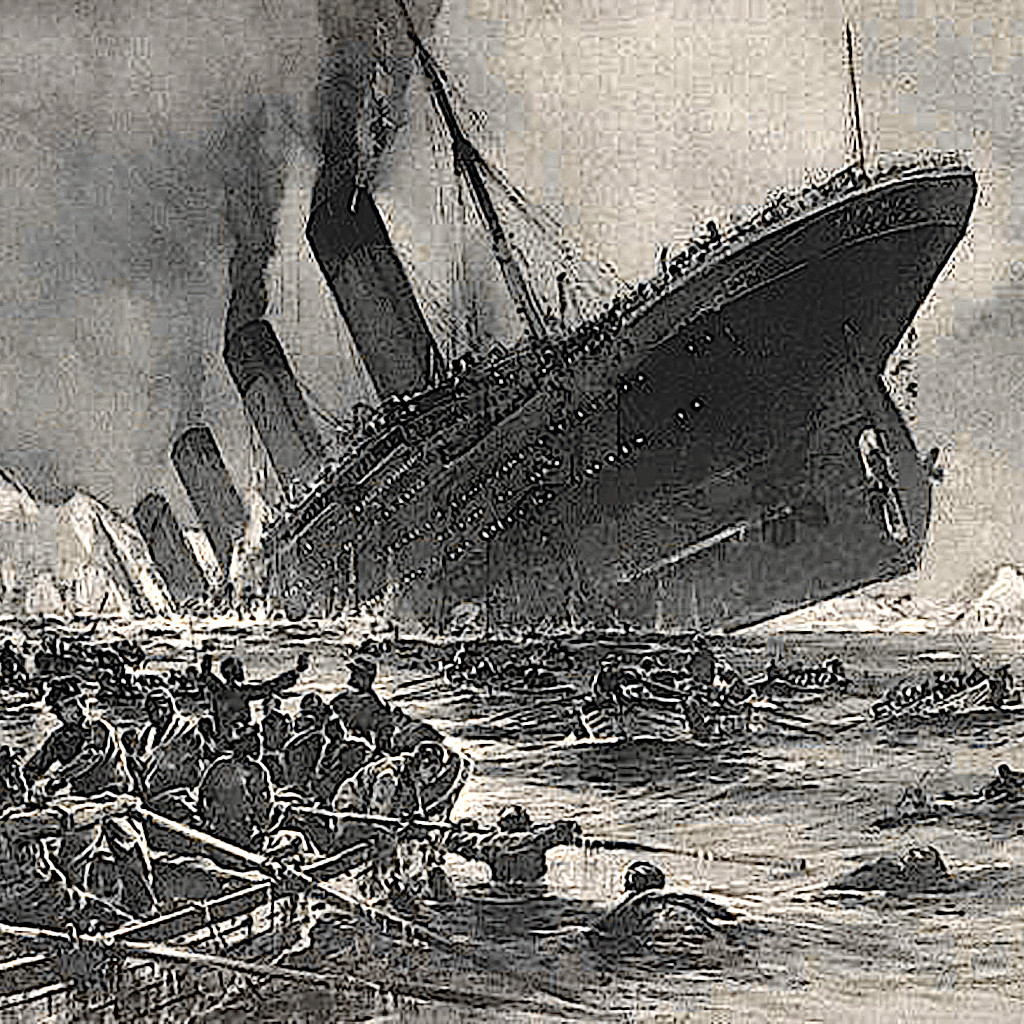
Having fun with the Titanic Problem… Machine Learning from the Disaster
This is originally a Kaggle problem where the task is: to build a predictive model that answers the question: “what sorts of people were more likely to survive?” using passenger data (ie name, age, gender, socio-economic class, etc). The data is broken into train and test sets in a ratio of approximately 68 to 32 …
Toronto Covid-19 Data
The Toronto public health unit recently announced that they are going release Covid-19 statistics. Values are reported by age, neighbourhood, outcome, and hospitalization type among other ways. Using this information, some visualizations were created to help try to find some insight in the dataset. One major limitation of the data is that is updated once …
Mapping Ontario Covid Data…
The goal is to make a web based map of Ontario that would both display and allow one to interact with Covid-19 data. Some maps have either used Google Maps or open street maps to show some key data elements. Others have static images that were created in some other piece of software that needs …

Exploring Ontario Covid Case Data… part 3
This is the continuation of Exploring Ontario Covid Case Data… part 2, hence the same dataset is being used (source: Ontario Government’s website). Data Processing and Visualization Code All the code is available in this GitHub repository. Python (Pandas) was used to process all the data while the visualization was created with the D3 library …

Exploring Ontario Covid Case Data… part 2
Ontario has two Covid-19 datasets available on its Data Catalogue website. Previously, the Covid-19 Case data was examined, and now the Covid status data will be further explored. Note: I am not an epidemiologist. Any results and conclusions are made for my own personal amusement and education (and perhaps to show a possible employer). This …

Exploring Ontario Covid Case Data… part 1
Since I live in Ontario, the status of causes is rather important for me. The provincial government has made ‘some’ data available on their website. To be honest, there is a fair bit of information that isn’t available for whatever reasons (their excuses fall short once you learn that other groups do release such data). …