This is the continuation of Exploring Ontario Covid Case Data… part 2, hence the same dataset is being used (source: Ontario Government’s website).
Data Processing and Visualization Code
All the code is available in this GitHub repository. Python (Pandas) was used to process all the data while the visualization was created with the D3 library (for Javascript).
Since scripts create the graphs and to keep the load on the server low, they are only run once a day. Also currently they are executed manually since the data can suddenly change from day to day (for example: new elements are added or removed or Null values introduced).
The date for all the graphs is listed below:
Looking at PHUs…
We can break down the age groups and outcome for each Public Health Unit (or PHU).
Click here to view the graph in a separate window without any wordpress page decorations (mobile friendly).
Some points to note:
- The Unkown age group is not listed used in the graph. Approximately, 0.3% are unknown and all are from Toronto or Mississauga, two PHUs with so many cases that by omitting these values the overall results will not be impacted too drastically.
Some of these cases occurred more than two months ago. One would think that it within that amount of time the age could be determined. Also for this dataset the age does not need to be known; since a range is used, one could estimate something since a 10 year window can cover up any small errors with the estimate.
- There are some small discrepancies with the data. The data on the Ontario government’s website can be slightly different than what is listed on a specific PHU’s website. For example, some of this is a difference in how cases are counted; some totals include both confirmed positive (correct) and probable cases (really?). I am not an epidemiologist so I am not going to speculate on reasons why the results are different.
Examining Dates
The dataset has 4 fields related to date. These include:
- Accurate Episode Date: The field uses a number of dates entered in the Integrated Public Health Information System (iPHIS) to provide an approximation of onset date.
- Case Reported Date: The date that the case was reported to the local public health unit (PHU).
- Test Reported Date: The test reported date as indicated on the laboratory slip.
- Specimen Date: Set to the earliest specimen date on record for the case, as indicated on the laboratory slip.
Note: All these definitions were taken from the data dictionary for the dataset.
From some separate analysis, both the Test Reported Date and the Specimen Date fields contain a small amount of null values. Hence, the Accurate Episode Date and Case Reported Date fields will be used for our analysis.
The following is a graph of the total of all cases reported on each date listed in the Accurate Episode Date and Case Reported Date fields. For clarity, I have added the ability to show a 3, 5, 7, or 11 day moving average.
Out of curiosity, the day of the week was determined for all of the dates listed in both fields. While things are mostly balanced, Fridays and Mondays seem to get a bit more attention.
Next, the differences between the Accurate Episode Date and Case Reported Date fields for each case was found. They were grouped together in the following distribution (note difference counts and overall percentage is shown as a tooltip). Overall, the one could expect a result to be reported back 0 to 3 days after they are tested.
About the tail in the above distribution… manually examining the data, it seems that there are errors in how the data has been entered. It appears that the most common error was the date format; that is for some entries the date is in ‘YYYY-MM-DD’ format while for others its ‘YYYY-DD-MM’. Transposing day for month can add 30 or more days when a difference is determined.
Examining the Not Resolved Cases
Perhaps the most interesting data is the not resolved cases (or the current number of infections). Some of the older cases either have truly not been resolved yet, or have the transposing of the day & month problem. Since I am not an epidemiologist, I’m not going to try to speculate why there was a massive spike in infections at the beginning of June.
Last 14 Days…
The following is a graph of the number of new infections over the last two weeks for each age group. Note that at tool tip is displayed for each age/day combination showing the number of cases for each Public Heath Unit.
Click here to view the graph in a separate window without any WordPress page decoration (for mobile users).
Comment about the Data
There are a few issues with this data. Namely, null values, day-month transposing, data differences, and missing information
Null Values
The Test Reported Date and the Specimen Date fields contain a small amount of null values. One has to wonder why? Dates can be automatically generated when a new record is created or a transaction occurs.
Day-Month Transposing
As mentioned above, there seems to be a problem that some dates are using one format while others use another. Then the month and day values get transposed.
Differences Between PHU and Official Data
Recently it was reported that Toronto had its 1000th Covid-19 death. Examining my graphs, the total number of fatalities I had was in the 900s. I was curious so I wrote some code to verify my results…
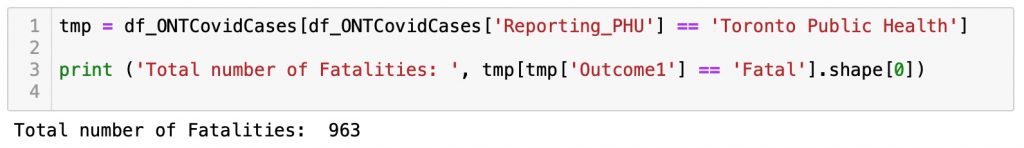
Since I first wrote this the value is much closer to 1000. So it seems that there might be a day or so of delay. Or that PHUs may report data before it gets uploaded to the provincial database.
Missing Information
The only thing better than some data is perhaps even more data. I really wish that the dataset provided more information such as:
- Presence of any comorbidities
- Any specific details about the case (such as patient is an migrant agriculture worker, health care worker, or long term care resident)
- Further break down the location of the case. A PHU can be large in area or population.
No Comments