A while ago I was curious with the idea of motion tracking using and Arduino and some inexpensive sensors. It was one of my first more complete Arduino project where a variety of code had to written to handle serial communication, 3D graphics, and an OSX (i.e. Mac Desktop) application.
Quick Background on Tracking
There are a variety of reasons why someone would want to capture and track the motion of an object, body, or person, including health care, entertainment, and manufacturing. Some of the main motion tracking technologies include:
Camera/Visual Based Systems
Camera/Visual based systems use optical sensors (such as cameras), very accurate positions can be obtained. Visual movement tracking is available in two different styles: either with or without fiducial markers based.
- Visual Marker Based Tracking: Reflective markers attached to human joints and cameras pointed toward human body to track any movement. They are considered the ‘gold standard’ because of their high accuracy for finding positions. The major drawback with these optical sensors is that the items/markers can become overlapped and hence tracking capabilities can be lost.
- Marker Free Visual Based: Advanced image processing algorithms can be performed on multiple camera views to determine what is moving in a system. With the increased popularity of autonomous vehicles, research in such tracking algorithms have quite in demand (for example with the SLAM algorithm).
Electromagnetic Based
By moving a coil within an oscillating magnetic field, a current can be induced in the coil (characterized by Faraday’s law). By having multiple oscillating magnetic fields, and very sensitive detection circuitry, a position can be determined by triangulation techniques. Once calibrated, these positions can allow for accuracy on the order of one mm. By placing multiple coils together at various positions and angles, a full six degrees of freedom can be tracked in space. An example of electromagnetic tracking is the Aurora system by Northern Digital Inc.
Sensor Based
There are a variety of electronic motion tracking sensors that are each designed to measure a particular physical property.
- Tilt Sensors are perhaps the most simplest of all the types of sensors out there. Two states about the orientation can be determined, that is, if an object is orientated at 0 or 90 degrees. A classic example is the mercury based tilt switch, where a circuit becomes closed when the switch is in the correct orientation.
- Accelerometers are electromechanical devices that measure both linear and angular acceleration forces. They work by either using the piezoelectric effect or by the detection in the change of capacitance within tiny MEMs circuitry; and they report the change in velocity in meters per second squared. The acceleration forces can be static or dynamic; for example such as with the force of gravity pulling at your feet (static), or from motion and vibrations (dynamic).
- Gyrometer sensors (or just gyro sensors) are used to determine the orientation, are also known as angular rate sensors or angular velocity sensors, since they work by sensing angular velocity changes over time. They usually report results in revolutions per second (RPS) or degrees per second. When a rotation motion occur, the gyro rotates causing an angular velocity change which then converted into an electrical signal. Currently gyroscopes are available that can measure rotational velocity in all three Cartesian axes. Note that initially gyro sensors where mechanical devices consisting of spinning rotors, but they have since evolved to electronic and even optical devices.
- Magnetometers are devices that measure the strength and direction of magnetic fields. Note that these sensors are usually called digital compasses when used with various consumer electronics (such as mobile phones). This is usually done by measuring the yaw angle (y), which is perpendicular to the direction of gravity. Using the Earth’s magnetic field, the sensor can determine the orientation relative to its position on the Earth. Hence, magnetometers can determine the ‘north’ direction, which can be seen in smart phones when using a mapping application.
- Barometric pressure sensors can be used to detect the atmospheric air pressure with a reasonable amount of accuracy. Since pressure changes with altitude, these sensors can be used to determine height. Since the height is mathematically computed from the pressure, its resolution is dependent on the resolution of the pressure along with any errors associated with such sensors. Typically, the resolution of the pressure sensor is up to 0.03 hPa, which then allows height measurements of a 25 cm resolution.
- All in One Sensors: In many applications more than one type of sensor is needed (for example accelerometers and gyrometers are often used together). Hence, various manufacturers have combined different sensors into one package in order to save space and reuse certain system components. The newer generation of multi-packaged sensors include the three motion sensors including an accelerometer, gyrometer and magnetometer (sometimes referred to as a MARG sensor for Magnetic, Angular Rate, and Gravity). Often, manufacturers include barometric pressure sensors which allows height information to be also obtained from the sensors. Note that the combination of various sensors results in 9 or 10 DOF (degrees of freedom) sensors. The latest generation of such sensors also includes a small microcontroller which filters and combines the results from the three sensors. This additional step, makes such sensors more desirable to be used, however an extra is required. Also, options are available to allow the sensor to output unfiltered results (that is disabling the microcontroller).
Project Design
In this project, the aim is to track the motion of the human body, particularly arms while performing a few different repetitive tasks. For now, the project serves more as a proof of concept. Perhaps in the future, the results can be evaluated and a new and better version can be created.
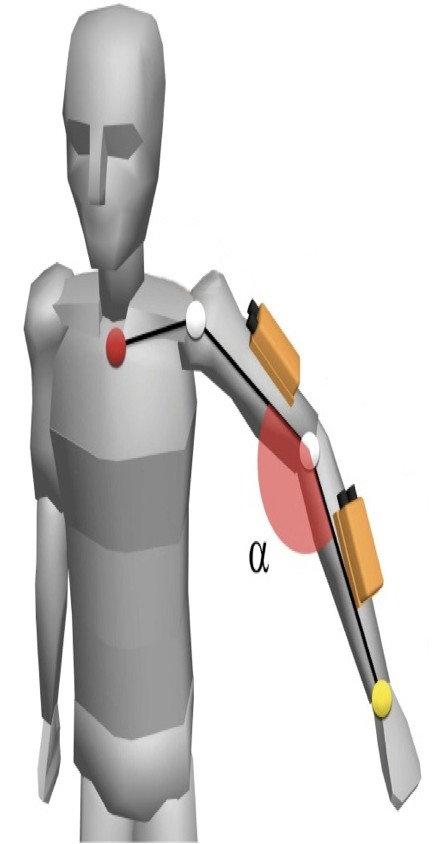
To enable tracking of the arm, two 9 DOF sensors were attached as shown in the diagram below. These sensors are attached to an arduino which in turn is attached to a computer. Because of the wiring, only a limited set of motions can be tracked, otherwise the connecting wire can get caught up in its surrounding and then detach from the arduino or even the sensors themselves. The arduino reads the values from the sensors and sends the results back to the computer which then records and displays the results.
Parts used
The majority of this project is software based, however the few hardware components required include:
- Any regular arduino board; by regular this means one of the standard off the shelf ones such as the Uno model. While any other fancier board can be used, we believe that simplest is best.
- Two Adafruit 9-DOF Absolute Orientation IMU Fusion Breakout boards. These roughly 1 inch square boards contain a Bosch BNO055 which combine and accelerometer, gyroscope, magnetometer and orientation software in one package. The complete documentation for the BNO055 is available here.
- Long length of heat shrink tubing used to wrap up and protect wires from the arduino and each sensor
- Velcro straps to allow sensors to be fastened to someone’s arms
- Wires; it might seem obvious enough but a few feet of wire are needed to connect and power the sensors. The arduino needs to be connected with a USB connector for both power and data communication.
Project Overview
This project involves multiple components that are linked together either physically or with software:
- Arduino and Sensors: an arduino will be used to interface with some sensors and communicate position information back to the main computer
- Wiring circuit: sensors will be connected on the same bus and communicate using the I2C protocol
- Arduino program: will initialize sensors and then send acquired information back the host computer using a simple serial protocol.
- Computer Software: a variety of software elements need to be created for this project
- Serial communication: code to listen to the serial port and interpret the information and convert it to the correct data structures before it is used by the other components.
- OpenGL display: draw the results of the sensors in 3D
- Data collection and analysis: be able to store data so that it can be analysed by other software. Also perform some simple analysis from within the software.
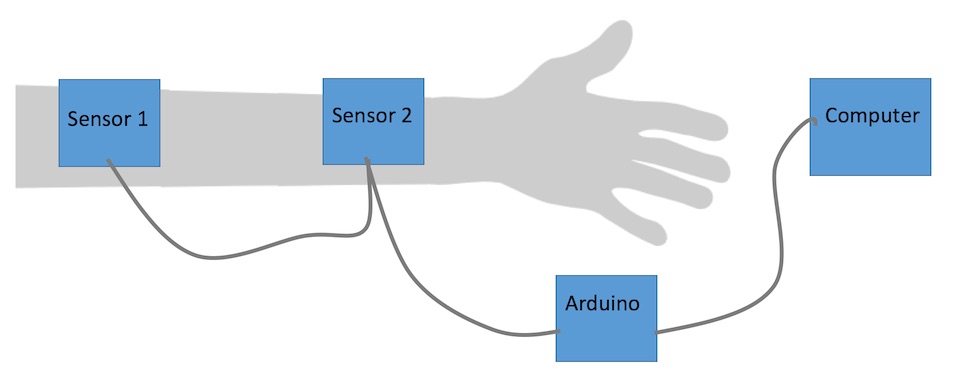
A brief overview schematic of the system is shown below. Note that Sensor 1 would be mounted to the upper arm, while Sensor 2 would be mounted to the forearm. The wires between the sensors and the Arduino is the I2C bus which consists of 4 lines: power, ground, data, and clock. The connection between the Arduino and computer is a regular USB cable.
Arduino and Sensors
An arduino was used since it is an easy way to interface the sensors to a computer via USB. Also the sensors consume a small amount of power so a standard USB 2 connection (which has 5 volts, 0.5 amps) is more than sufficient to power everything.
Connecting the Sensor
It is fairly easy to connect the sensor board (shown below) to the arduino. For the most part 4 connections need to be made, that is:
- Vin : 3.3-5.0V power supply input
- GND : The common/GND pin for power and logic
- SDA – data pin used by the I2C protocol; it can be connected to either 3 or 5V lines
- SCL : clock signal used by the I2C protocol; just like SDA, it can be connected to either 3 or 5V
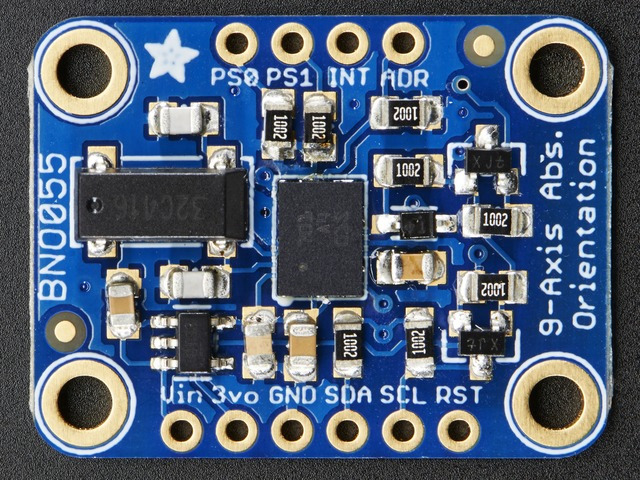
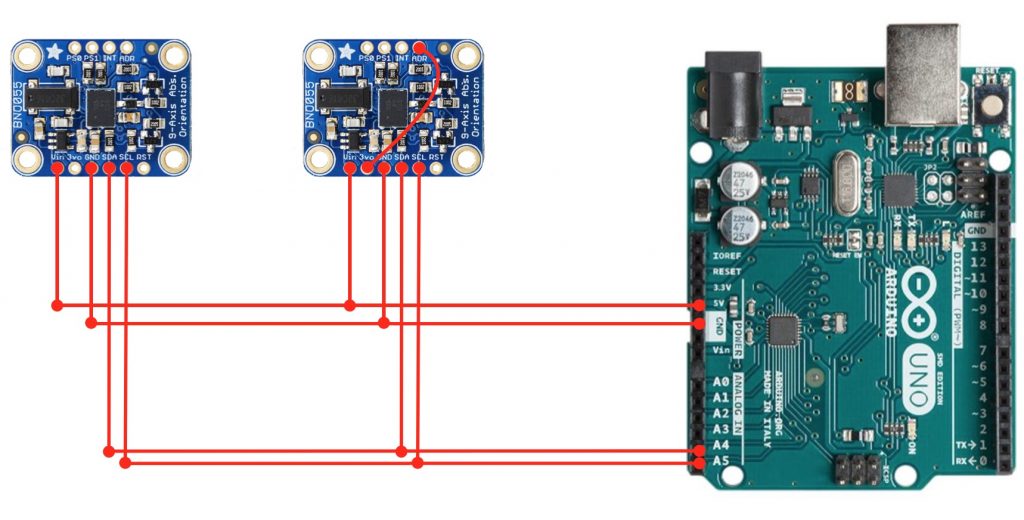
The BNO055 sensor allows for two sensors to be connected on one bus line. By default, the address of a particular sensor is 0x28. If the ADR pin is set to high (or 3V), the address can be changed to 0x29. The simplest method to change the address is to connect the 3vo pin (which is a 3V – 50 mA output) to the ADR pin.
The other pins do not need any connections, but out of curiosity they are: RST – hardware reset, INT – hardware programmable interrupt, and PS0 & PS1 – can be used to change the mode of the device but may need a firmware update to use them.
I2C
To connect the sensors to the Arduino, the I2C bus protocol needs to be used. From wikipedia, I2C can be described as:
I2C (Inter-Integrated Circuit), pronounced I-squared-C, is a synchronous, multi-master, multi-slave, packet switched, single-ended, serial communication bus invented in 1982 by Philips Semiconductor (now NXP Semiconductors). It is widely used for attaching lower-speed peripheral ICs to processors and microcontrollers in short-distance, intra-board communication
In short, I2C allows peripheral devices (that is sensors) to be easily connected to a microcontroller (the Arduino) by using the same data and clock lines. More information is available here and here.
The following image shows a simplified wiring schematic of how the sensors are connected to an arduino. Since the sensors will be moving, soldering should be done to ensure that the connection is won’t break during motion. Note, that the sensors’ SDA and SCL are connected to the arduino’s A4 and A5 pins respectively.
Arduino Programming
In order to deal with some of the lower level elements of the I2C protocol, the wire.h library was used to assist with all of the lower level calls. Next the AdaFruit sensor and BNO055 libraries were used to handle all the necessary elements with interfacing with the sensors.
In order to properly address each sensor the following code needs to be called at the beginning of the program:
Adafruit_BNO055 SensorA = Adafruit_BNO055 (55, BNO055_ADDRESS_A);
Adafruit_BNO055 SensorB = Adafruit_BNO055 (56, BNO055_ADDRESS_B);
The setup function specifies the frequency that information will be sent to the computer, tests to see if it can connect to the sensors, and checks to see if it has a valid connection with a host computer. The loop function, gets the orientation of each sensor and using Serial.print writes out the roll, pitch, and heading.
The communications protocol is simply the string ‘OA’ (or ‘OB’) followed by 3 floating values separated by spaces. Note that OA or OB stands for the orientation of sensor A or B. Also, the three values represent the rotation about the x, y, and z axes respectively.
Below is an example of the code used at each loop step:
sensors_event_t event;
SensorA.getEvent (&event);

Serial.print (F(" OA: "));
Serial.print ((float)event.orientation.x);
Serial.print (F(" "));
Serial.print ((float)event.orientation.y);
Serial.print (F(" "));
Serial.print ((float)event.orientation.z);
Serial.println (F(" "));
The full Arduino code is available here.
Software Details…
To make this project slightly more interesting for myself, I decided to write this as an OSX application. Hence, all of the code is written in Objective C and the application has a standard Mac feel to it.
Serial Communication
To make life a bit simple, the ORSSerialPort library was used to handle all of the serial communications. From its GitHub page, it can be described as:
ORSSerialPort is an easy-to-use Objective-C serial port library for macOS. It is useful for programmers writing Objective-C or Swift Mac apps that communicate with external devices through a serial port (most commonly RS-232). You can use ORSSerialPort to write apps that connect to Arduino projects, robots, data acquisition devices, ham radios, and all kinds of other devices.
To handle the reading of the data, the ORSSerialPort’s serialPort:didReceiveData function needs to be overwritten. In there, the data is parsed so that the orientation values for the particular sensor are saved in the correct variables.
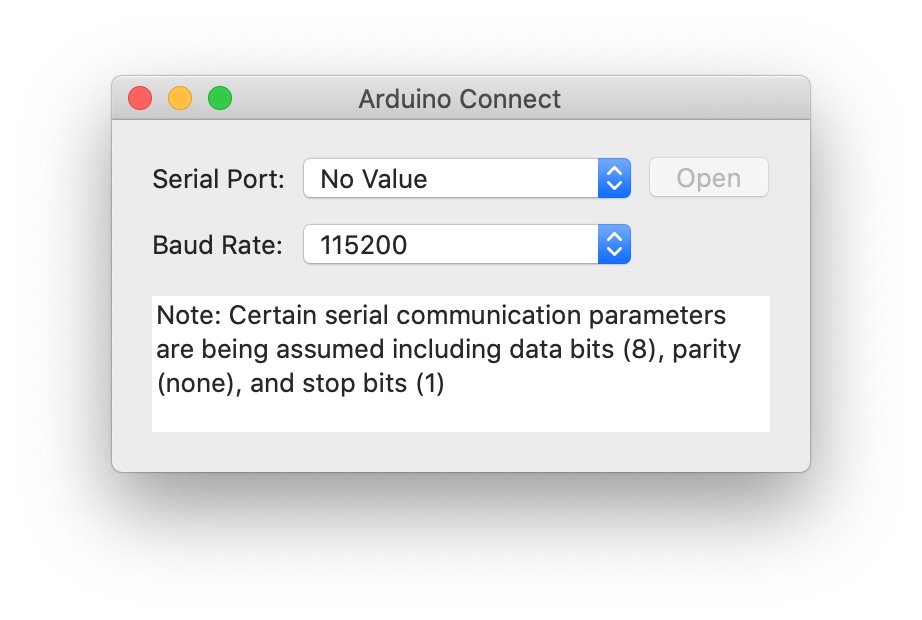
In the software, to start the serial connection, the Arduino Connect… command (from the Setup menu) needs to be executed. Then the following dialog (shown below) allows the user to select the port, speed, and connect to (or disconnect from) the Arduino and sensors.
OpenGL
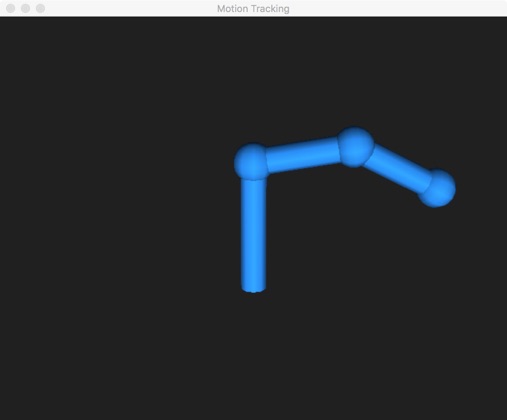
The values of the sensors were displayed in 3D in real time. This provided the user some visual feedback that the values were correctly obtained. Also, it is neat to watch the results being mirrored on the screen. Note that a few choices were made to keep things simple so that the project could be completed in the time allotted for it. First ‘classic’ OpenGL was used since it is much easier to code compared to ‘modern’ OpenGL (there was no learn curve with classic OpenGL but a fair bit of learning would be involved with to use any modern code). Next, the arm is drawn as either a set of boxes, lines, or cylinders.
Apple made it pretty easy to have 3D graphics within a dialog. All one needed to do is derive from NSOpenGLView and then overwrite the appropriate methods. Note that this is was the case, NSOpenGLView has been made deprecated since this code was originally written. Below is an example of the OpenGL output.
Note that OpenGL requires matrices so the orientation angles need to be converted before they are used. The following math what is needed to convert the yaw, pitch, roll angles (as \gamma, \beta, \mathrm{and}\ \alpha) is required to create the proper matrix that is used to orient the boxes/cylinders/lines (note that c represents cos and s represents sin):
Saving Data
It is possible to record and output all of the values from the sensors. From the Output Data… (from the Setup menu) there exists three key elements: Output options, Start, and Stop. The output options allow one to select which sensor and what values are to be recorded, while the start and stop control the how much data is recorded.
Code
All of the Objective C (OSX) code is available here.
Results
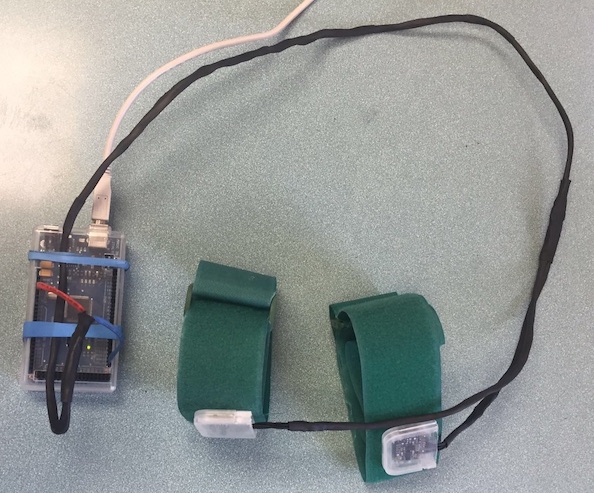
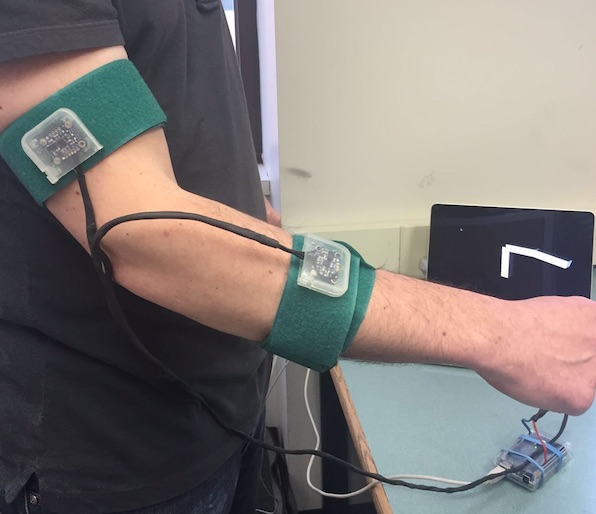
Below are some images and a video of some of the results. The top left image is of the two sensors mounted on velcro straps along with the Arduino. The top right image is of the system being used, with the sensors located on the arms.
Below is a video of early progress of the project. There are some bugs with the calibration, so there is some confusion between directions (particular what is up and down).
Future Work
This project was created fairly quickly and only the fundamentals were implemented. If time permits, this project might be revisited to add the following:
- The hardware could be improved so it is completely wireless. Perhaps a Bluetooth connection can be used instead of a serial connection
- The sensors tend to slip around a lot. A better fastening system than velcro needs to be used
- Improving the 3D drawing to have some nicer visualization. This could be some type of cartoon anatomy or even bones
- Allow for the leg motion to be measured as well. This could involve other elements such as the wireless connectivity, visualization, data analysis.
- The calibration was not mentioned in this document since it is not that great and needs to be further improved
- Better data handling and analysis needs to be done in this project. There is a whole world of analysis that can be done.
No Comments