So one of my projects right now involves plotting differential equations. I want to make an interactive web-based tool to play around with the solution to a set of differential equations. In my recent course we used a few different data visualization tools and they all had some issues:
- Matplotlib… can only make static graphs in python that are a bit ugly
- Seaborn… also can make static graphs in python but are nicer looking
- Tableau… I like tableau for a few things like connecting to a database. However, I am not sure about using it to graph differential equations and having nice interactivity to explore various solutions. Also, my tableau licence expired.
- plotly… I do like plotly to a certain extent. After trying some stuff out, I realized that I want more… I want to be able to have more control and flexibility with my visualization even if it means more work
- ggPlot… I don’t want to use R
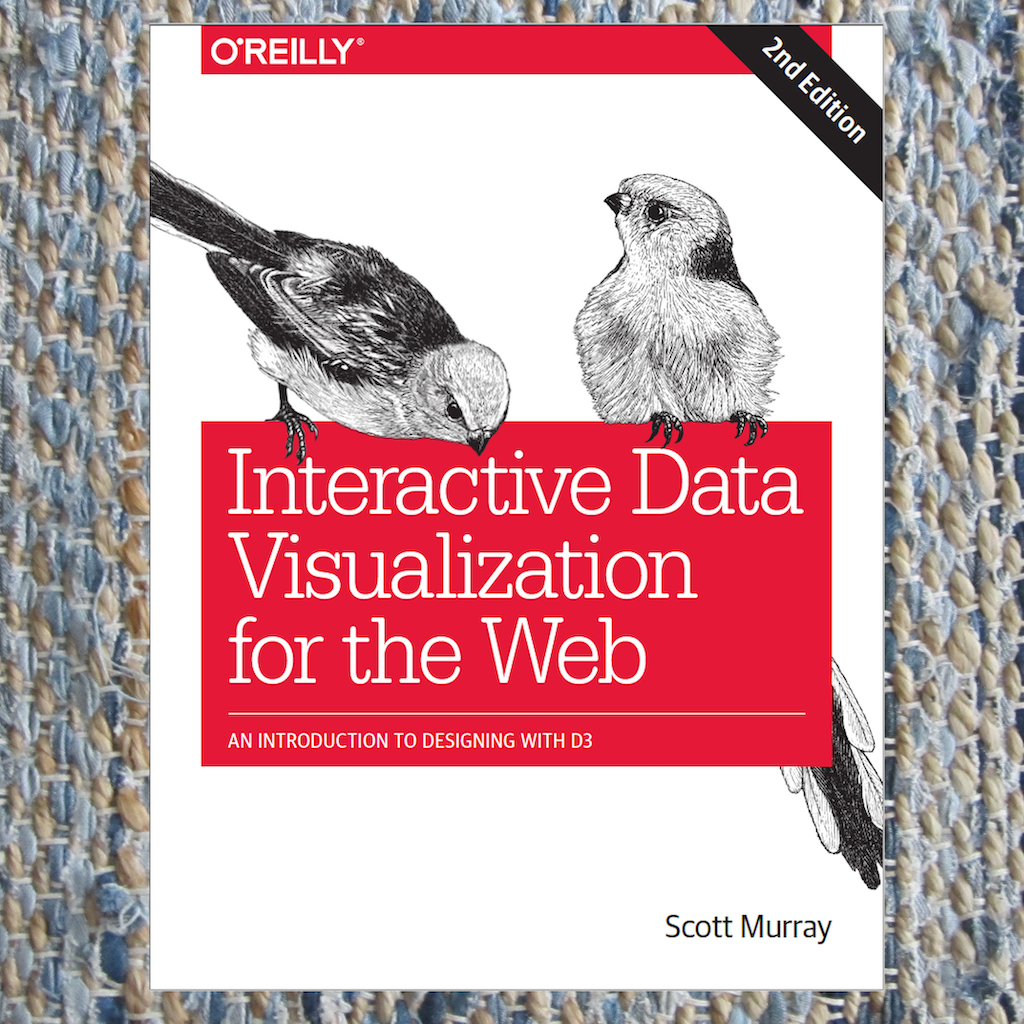
So I came across this book about D3, and because of the Rona I had some extra reading time so I decided to dive in…
This book is great! I can’t say that I’m an expert on all the different concepts but they will come with practice. It seems that there are more than enough examples out there to complement this book (particularly at bl.ocks.org).
So the things that I really like about D3 include:
- First the obvious… D3 allows you to make graphics for the web, not some other tool that can then eventually be put onto the web after jumping through enough hoops.
- Full control of almost every graphical element. One can be free and make graphs exactly how they want them to be.
- D3 allows for interactive graphs. Thanks to the fact that everything is written in javascript, callback functions can be associated to any element and therefore interactivity can be obtained.
- D3 also has animated transitions which the other systems mentioned above (other that plotly) do not. Basically, when going from one state to another, the data can be interpolated so that smoothly transitions rather than abruptly jumping.
- Graphs are SVG objects, so all the nice elements of vector graphics are gained.
- Being built on javascript has a variety of elements.
- Using CSS to control the drawing style. By following a naming convention for various classes and elements, different graphs can have a nice uniform flow between them.
- There are a lot of other nice open source JS libraries out there that can be used along with D3 to make things even better
- Also, there is a huge javascript knowledge base out there. Answers to questions that are partially related to D3 can be found out there.
- Finally, I have to admit that I am new to making maps for the web. But I do like how maps are handled in D3.

No Comments