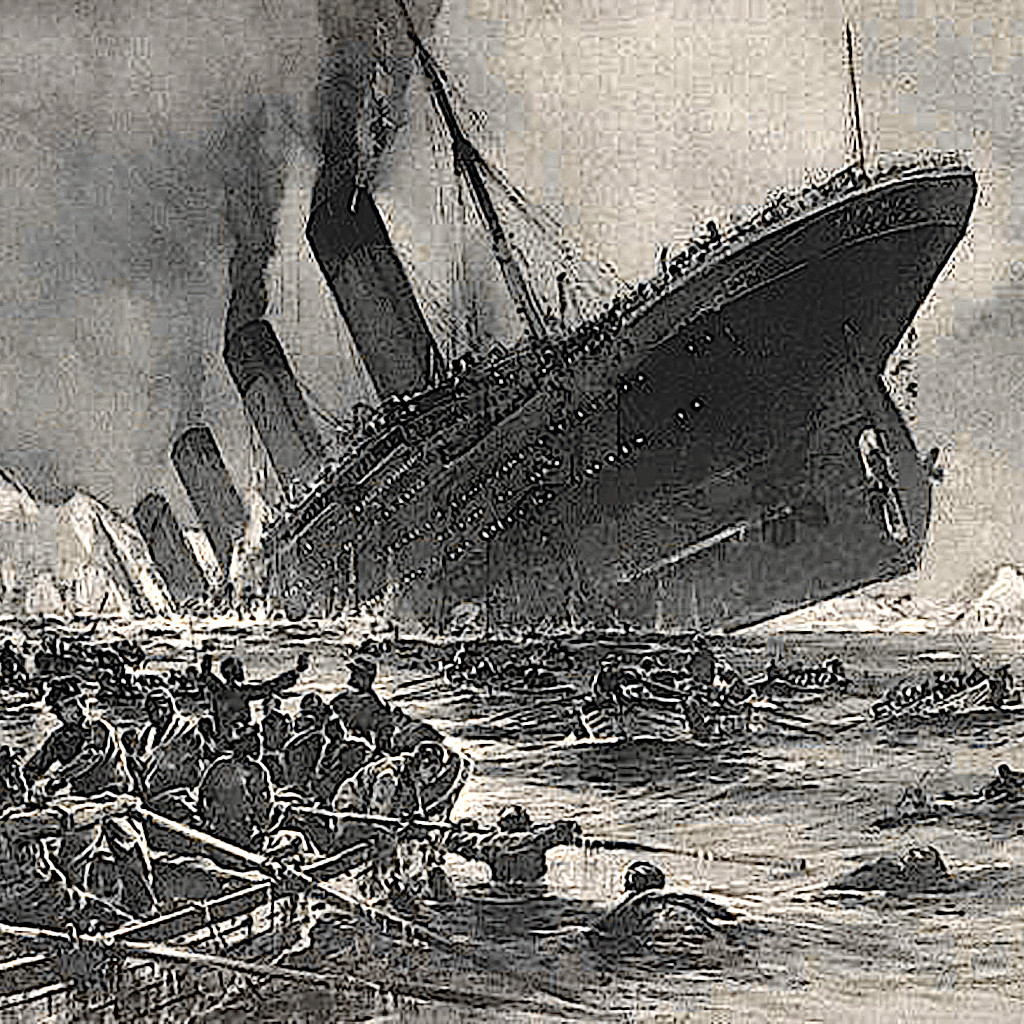
Having fun with the Titanic Problem… Machine Learning from the Disaster
This is originally a Kaggle problem where the task is: to build a predictive model that answers the question: “what sorts of people were more likely to survive?” using passenger data (ie name, age, gender, socio-economic class, etc). The data is broken into train and test sets in a ratio of approximately 68 to 32 …
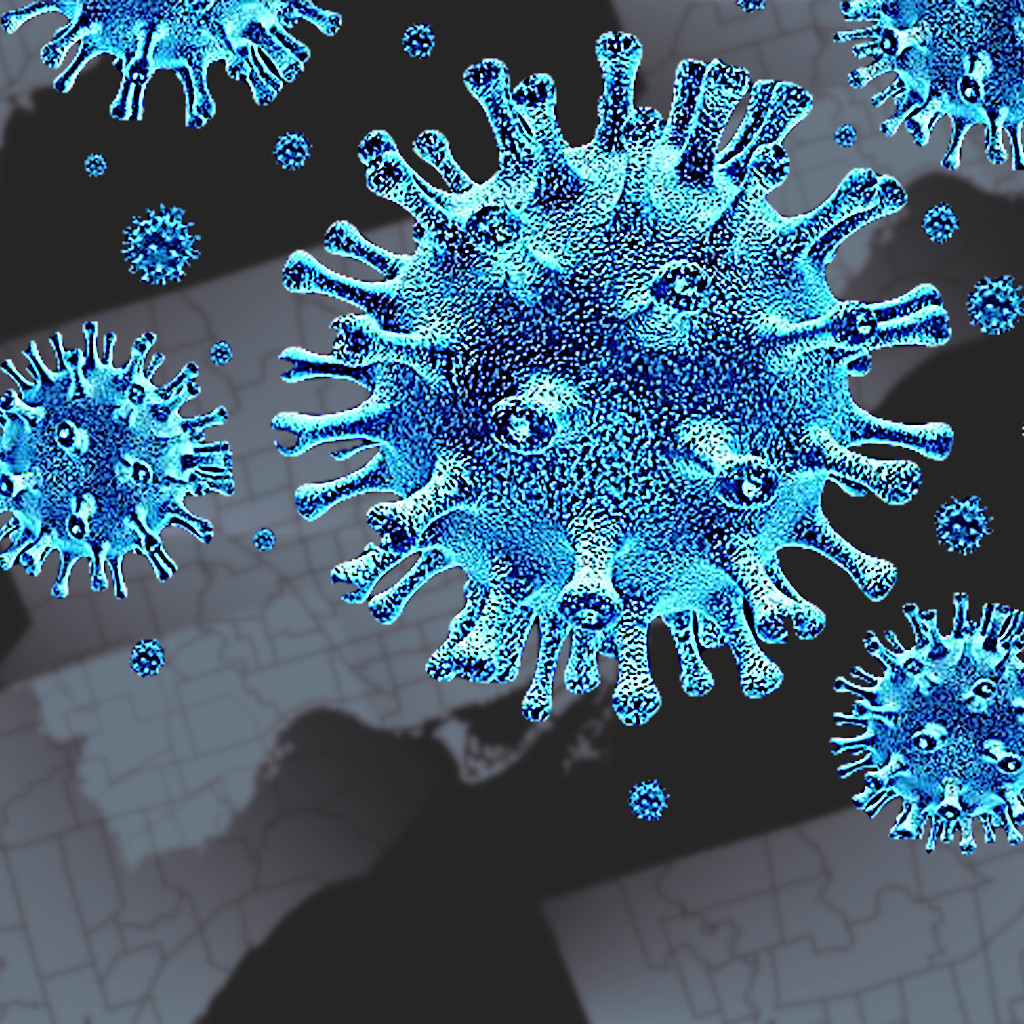
Toronto Covid-19 Data
The Toronto public health unit recently announced that they are going release Covid-19 statistics. Values are reported by age, neighbourhood, outcome, and hospitalization type among other ways. Using this information, some visualizations were created to help try to find some insight in the dataset. One major limitation of the data is that is updated once …
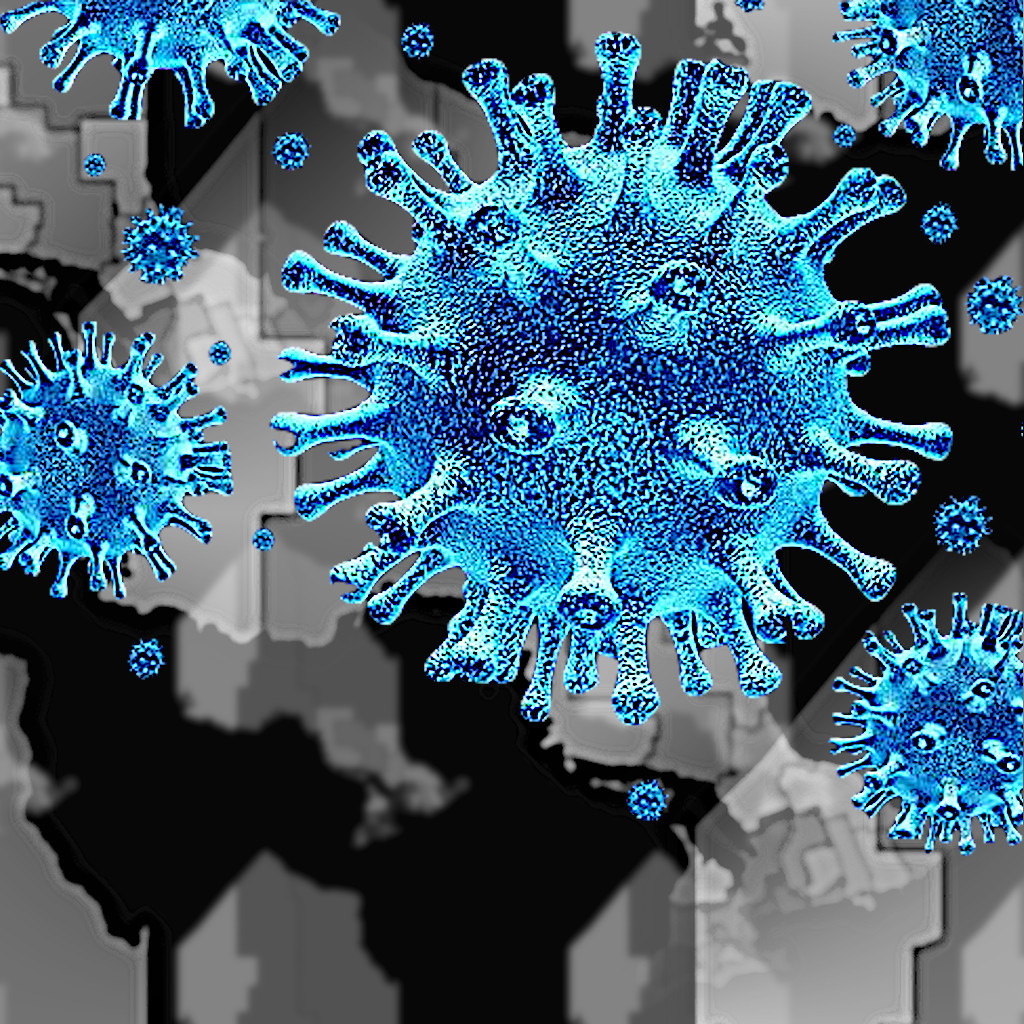
Mapping Ontario Covid Data…
The goal is to make a web based map of Ontario that would both display and allow one to interact with Covid-19 data. Some maps have either used Google Maps or open street maps to show some key data elements. Others have static images that were created in some other piece of software that needs …

Exploring Ontario Covid Case Data… part 3
This is the continuation of Exploring Ontario Covid Case Data… part 2, hence the same dataset is being used (source: Ontario Government’s website). Data Processing and Visualization Code All the code is available in this GitHub repository. Python (Pandas) was used to process all the data while the visualization was created with the D3 library …

Exploring Ontario Covid Case Data… part 2
Ontario has two Covid-19 datasets available on its Data Catalogue website. Previously, the Covid-19 Case data was examined, and now the Covid status data will be further explored. Note: I am not an epidemiologist. Any results and conclusions are made for my own personal amusement and education (and perhaps to show a possible employer). This …

Exploring Ontario Covid Case Data… part 1
Since I live in Ontario, the status of causes is rather important for me. The provincial government has made ‘some’ data available on their website. To be honest, there is a fair bit of information that isn’t available for whatever reasons (their excuses fall short once you learn that other groups do release such data). …

Looking at the SEIR Virus Model…
The SIR Model is a little basic and does not model Covid-19 very well. The SEIR model introduces extra parameters that can make the modelling a bit more accurate. The main change is the introduction of a new ‘exposed’ compartment, so we now have Susceptible, Exposed, Infected, and Recovered (or removed) compartments: There is a …

Solving the SIR Virus Model…
Due to the current covid-19 outbreak there has been a fair bit of interest in virus modelling lately. The models that the media have published/produced vary from the over simplified (and often incorrect) to the complex (with many missing details). I have already looked at numeric simulations using a bouncing ball model, this time a …
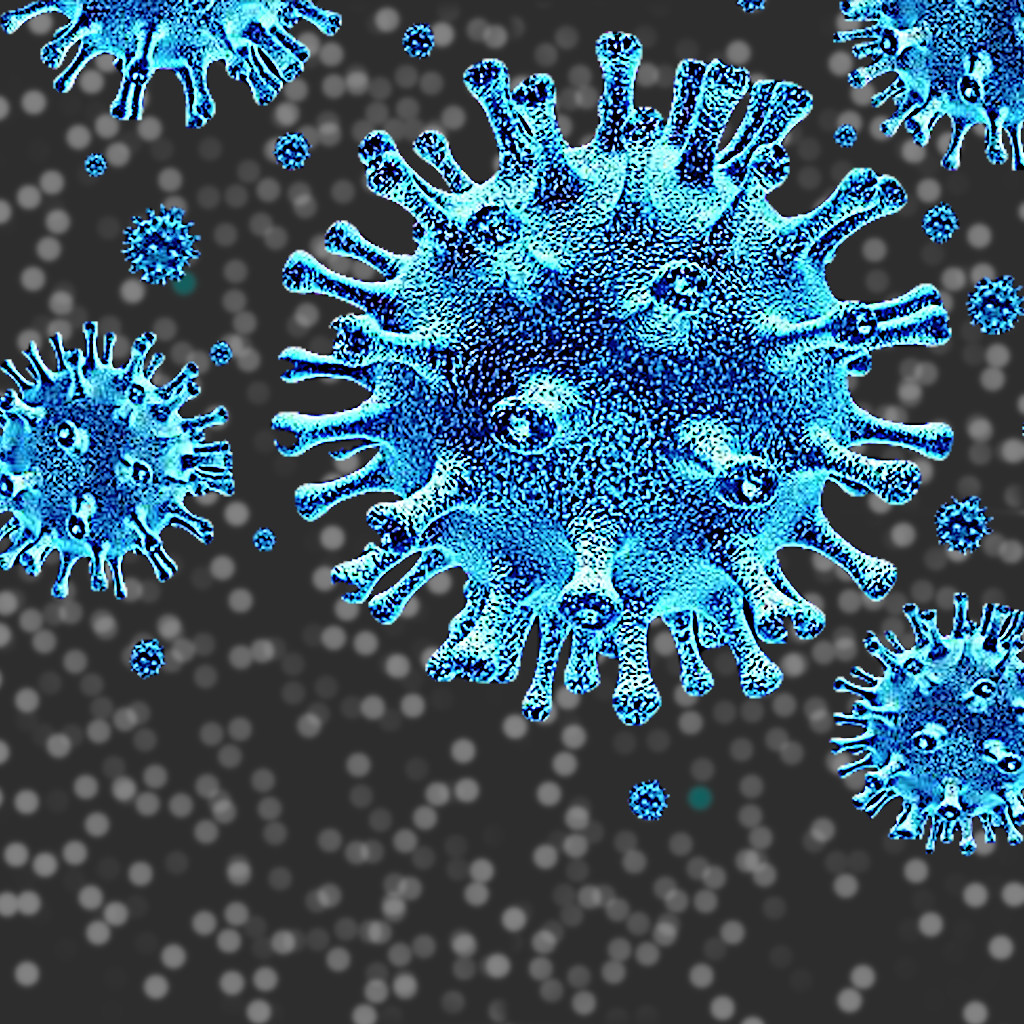
Visual Simulations of Virus Propagations…
With the current Covid-19 pandemic, there has been some talk about virus propagation in the media. It seems that there is a lot missing among the various news sources. I find that their explanations to either be not technical enough or just missing a lot of key details. Also, I expect that certain types of …

Making Books with Latex…
A while ago I took a course and the vast majority of the useful information was presented in powerpoints and source code comments (via Jupyter notebooks). With all the spare time that covid has provided me, I have been trying to revisit that course and with the help of some normal formal textbooks, make a …